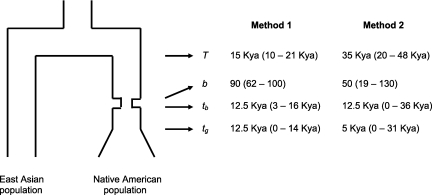
FIG. 2.
Diagram of the demographic model used, with estimates and 95% confidence intervals (in parentheses) for T, the time when the two populations split; tg, the time of onset of population growth,; tb, the time since the end of the population bottleneck; and b, the strength of the bottleneck. Parameter estimates, along with approximate 95% confidence intervals in parentheses, are given to the right of the figure. Method 1 is the composite likelihood method described in Plagnol and Wall (2006), and method 2 is a summary likelihood method described in the Materials and Methods.

