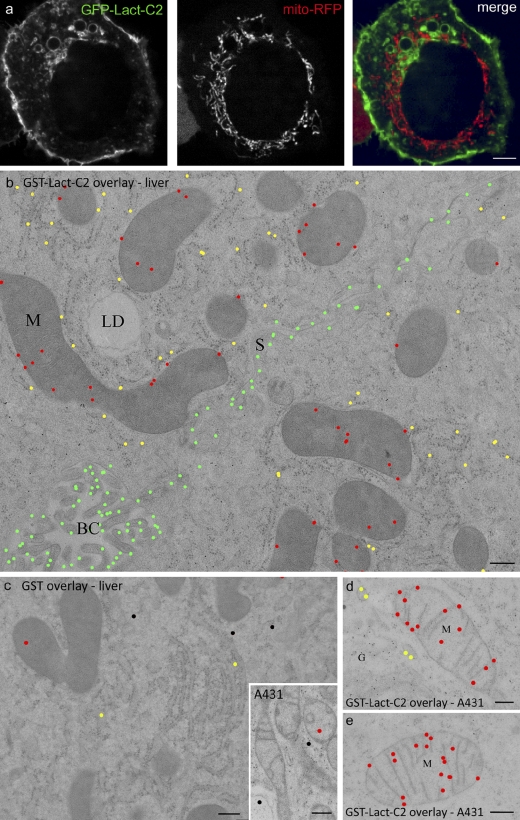
Figure 3.
On-section ultrastructural localization of PS. (a) A431 cells transiently cotransfected with GFP-Lact-C2 (left) and mito-RFP (middle). The images are overlaid on the right. (b–e) Mouse liver (b and c) and A431 samples (d and e) were processed using HPF/FS/LTE. Sections were incubated with purified GST-Lact-C2 (b, d, and e) or with GST (c and inset) and labeled as described in Materials and methods. Images were color-coded to indicate specific compartments: green, PM; red, mitochondria; yellow, RER; black, unassigned. Note the specific labeling of mitochondria, the RER, and the PM with GST-Lact-C2, compared with GST alone. Unmodified images of b–e are provided in Fig. S5. G, Golgi complex; LD, lipid droplet; S, sinusoidal membrane; BC, bile canaliculus. Bars: (a) 4 µm; (b–e) 200 nm.

