Figure 3.
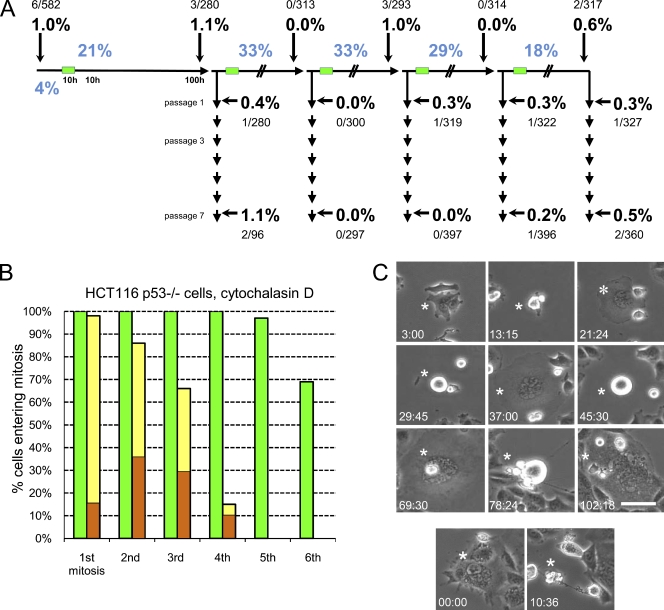
Centrosome amplification and proliferation of HCT116 p53−/− cells after cleavage failure. (A) Centrosome amplification in proliferative HCT116 p53−/− cell populations after repeated cleavage failure. The experimental protocol and display of the results are the same as those shown in Fig. 1 A. Large multinucleated cells are not scored because they do not proliferate. The percentages of binuclear cells after cytochalasin treatments are shown in blue. The percentages of centrosome amplification (more than four centrioles) are shown in bold with the number of cells counted shown above or below. (B) Proliferative capacity of binuclear cells (yellow bars) and same-preparation control cells (green bars). Orange portions of the bars indicate the percentages of cells that spontaneously fail cleavage at mitosis. Such cells cycle but repeatedly fail cleavage and cease proliferating. One experiment is shown on multiple cells. (C, top) Binuclear cell (asterisks) exhibiting multiple rounds of cleavage failure, resulting in a large multinucleated cell. (bottom) Death of another large multinuclear cell. Times are in hours and minutes. Phase-contrast microscopy is shown. Bar, 50 µm.

