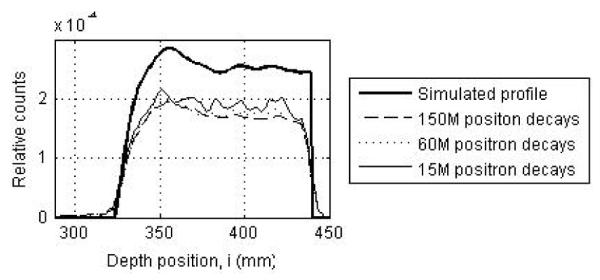
Figure 12.

Depth profiles drawn through PET images acquired in a two-third ring LYSO PET scanner with 300ps timing resolution for 150M, 60M, and 15M positron decays. The thick solid line shows the simulated profile. The simulated scanner had 4×4-mm2 LYSO crystals.
