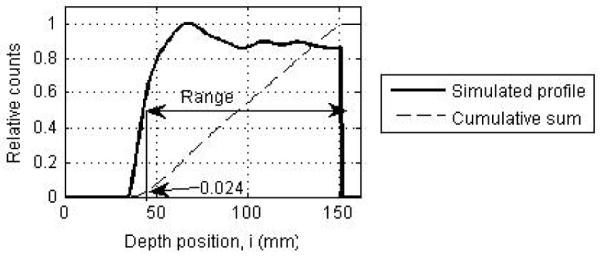
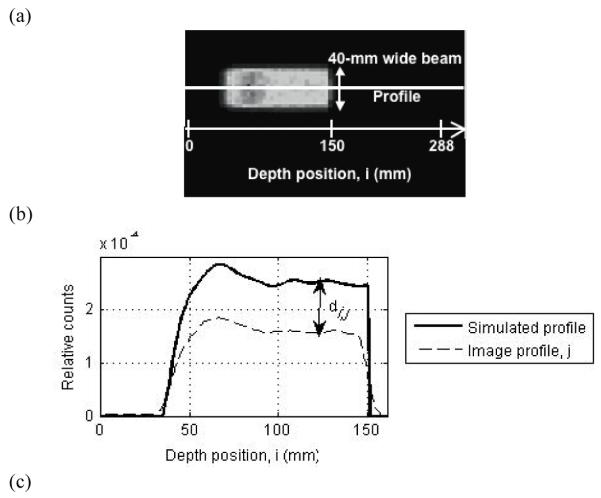
Figure 3.

(a) Transverse slice of a reconstructed PET image of the positron emitters produced after a proton beam irradiation. The solid white line shows a depth profile, j, drawn through this image. Since the beam is 40-mm wide orthogonal to the depth direction, 36 central depth profiles were drawn for analysis. (b) Depth profile from the PET image (dashed line) and the depth profile of simulated activity (solid line). Profiles are normalized to total counts in the image. The image profile is shown for a full ring Non-TOF scanner design. (c) Simulated depth profile (solid line) normalized to its peak position and cumulative sum of the profile (dashed line) normalized to total counts in the image. The profile range is defined as the position where the profile has a value of 0.5, which also corresponds to a value of 0.024 on its cumulative sum.

