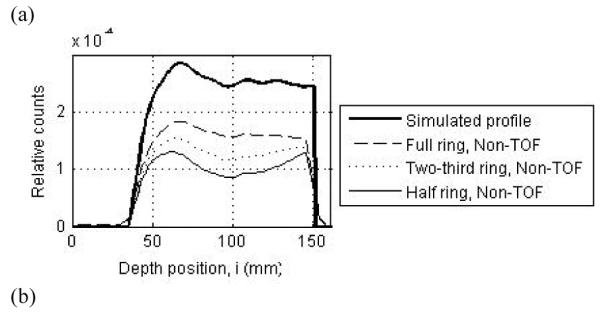
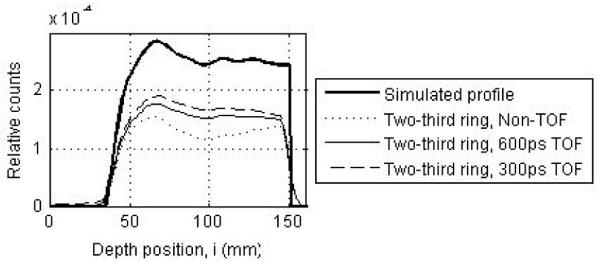
Figure 9.


(a) Depth profiles drawn through the central transverse image of Non-TOF scanners with a full (dashed line), two-third ring (dotted line), and half ring (thin solid line). (b) Depth profiles drawn through the central transverse image of a two-third ring scanner operating in a Non-TOF mode (dotted line), and TOF mode with timing resolutions of 300ps (dashed line) and 600ps (thin solid line). For comparison the simulated profile is shown as the thick solid line in both plots. The simulated scanner had 4×4-mm2 LYSO crystals.
