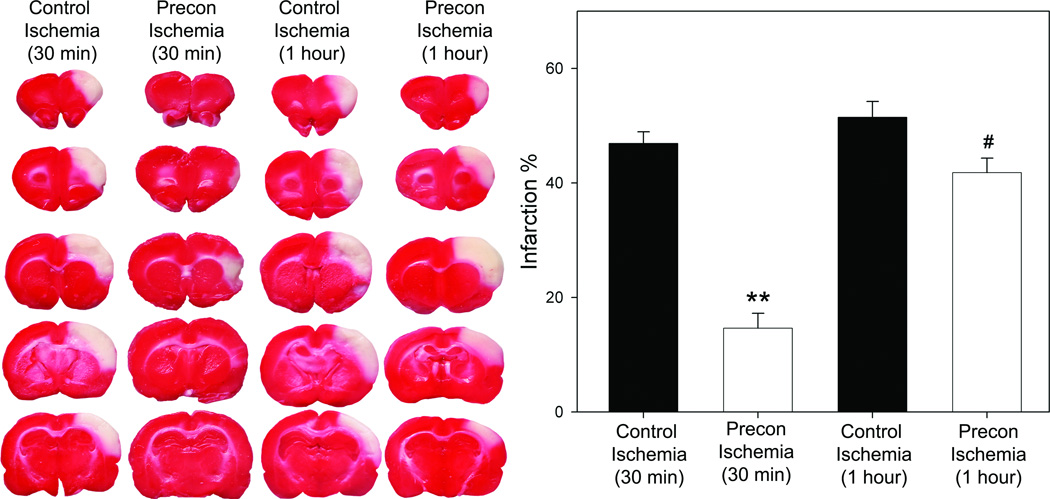
Fig. 2.
Rapid preconditioning significantly inhibited ischemic damage. Ischemic brains were harvested at 2d after stroke for TTC staining. Representative brain sections stained with TTC are shown in the left column. The bar graphs (the right column) represent the average infarction size normalized to the non-ischemic cortex. Animal numbers in each group from the left to the right on the bar graph are 7, 7, 5 and 6, respectively. *** vs control ischemia (30min), P<0.001; # vs control ischemia (1hour), P<0.05.

