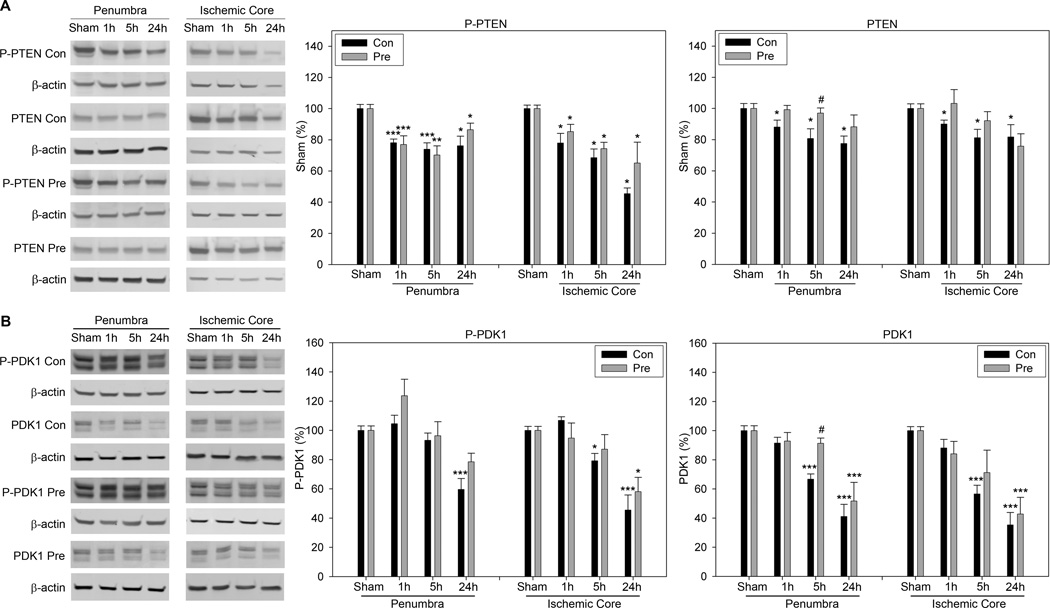
Fig. 5.
A. The effect of preconditioning on P-PTEN and PTEN levels. Representative Western blot for P-PTEN, PTEN and β-actin are shown. The bar graphs stand for statistical results of protein level of P-PTEN and PTEN, respectively. *, **, *** vs sham, P<0.05, 0.01. 0.001; # vs control at corresponding time point, P<0.05. B. The effect of preconditioning on levels of P-PDK1 and total PDK1. The two left columns are representative protein bands of Western blot for P-PDK1, PDK1 and β-actin in the ischemic penumbra and core. The bar graphs in the right two columns represent average densities of P-PDK1 and PDK1, respectively. *, **, *** vs sham, P<0.05, 0.01, 0.001. # vs control at corresponding time point, P<0.05. N=5–6/group.

