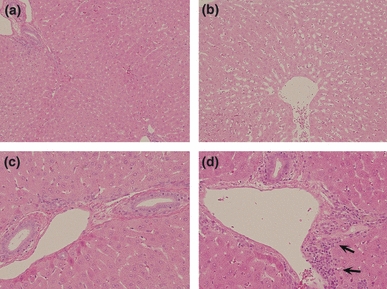
Figure 3.

Histopathology in the liver. The diffuse hepatocellular atrophy [(b); H and E, 100×] as well as periportal lymphocytic infiltration [(d) 200× magnification; arrows] was observed in the high-dose alcohol group in comparison with a physiologic saline group [(a) 100×, (c) 200×].
