
Figure 2.
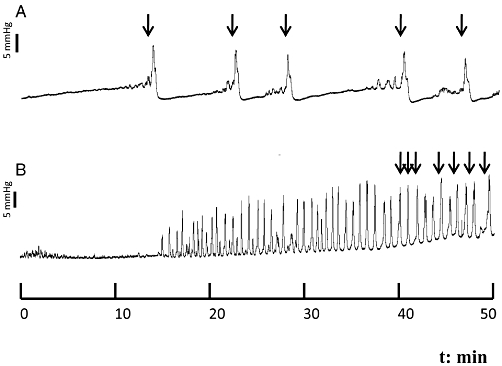
Representative cystometric recording from control (A) and streptozotocin-induced diabetic mice (B). Arrows in the cystometric trace indicate the micturition peaks.
Official websites use .gov
A
.gov website belongs to an official
government organization in the United States.
Secure .gov websites use HTTPS
A lock (
) or https:// means you've safely
connected to the .gov website. Share sensitive
information only on official, secure websites.
Representative cystometric recording from control (A) and streptozotocin-induced diabetic mice (B). Arrows in the cystometric trace indicate the micturition peaks.