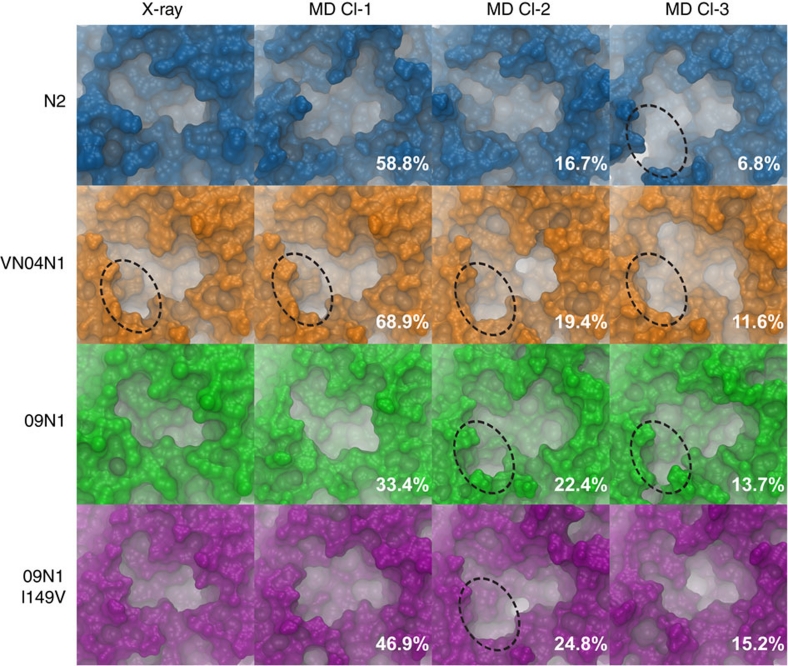
Figure 1. Solvent accessible surface area of NA-binding site.
The solvent accessible surface area of the NA-binding site is shown, as computed by the MSMS30 program, for the X-ray structure, and top three most dominant central member cluster structures (population percentages indicated in white text for each cluster), shown for A/Tokyo/3/67 (N2), A/Vietnam/1203/04 (VN04N1), A/California/04/2009 (09N1) and the 09N1_I149V mutant strain. The open 150-cavity, where present, is outlined with a dotted circle.

