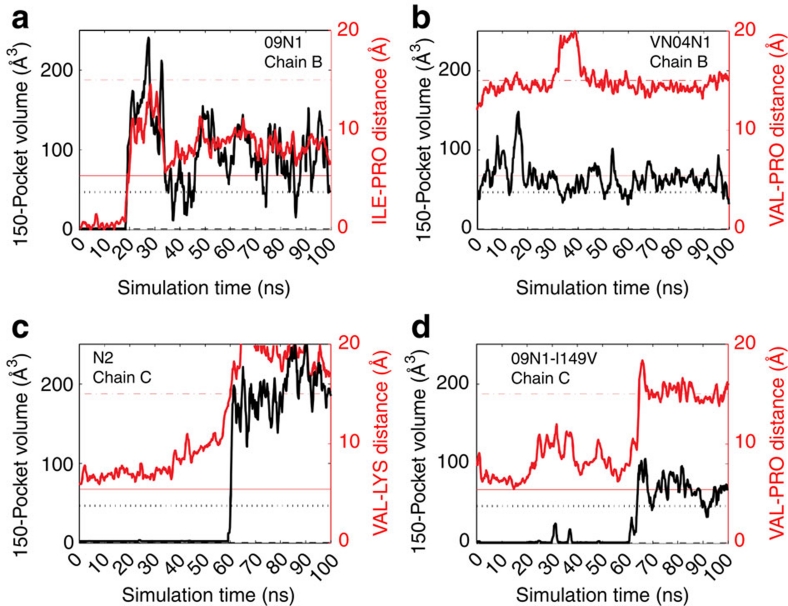
Figure 2. Time series analysis of 150-cavity volume and width for a particular monomer in each of the simulated systems.
On the left-side y axis, the volume of the 150-cavity is computed over the course of simulation. The distance between alpha-carbon of residue 431 (PRO in a, b, d; LYS in c) and the closest side-chain carbon of residue 149 (Val149 panels b, c, d; ILE in a) is computed and shown in red and the right-side y axis. The black and red dotted lines correspond to the open crystal structure (2HTY) volume and distance, respectively; whereas the black dashed and red solid lines correspond to the closed crystal structure (2HU4) volume and distance, respectively. The systems shown are A/Tokyo/3/67 (N2), A/Vietnam/1203/04 (VN04N1), A/California/04/2009 (09N1) and the 09N1_I149V mutant strain.

