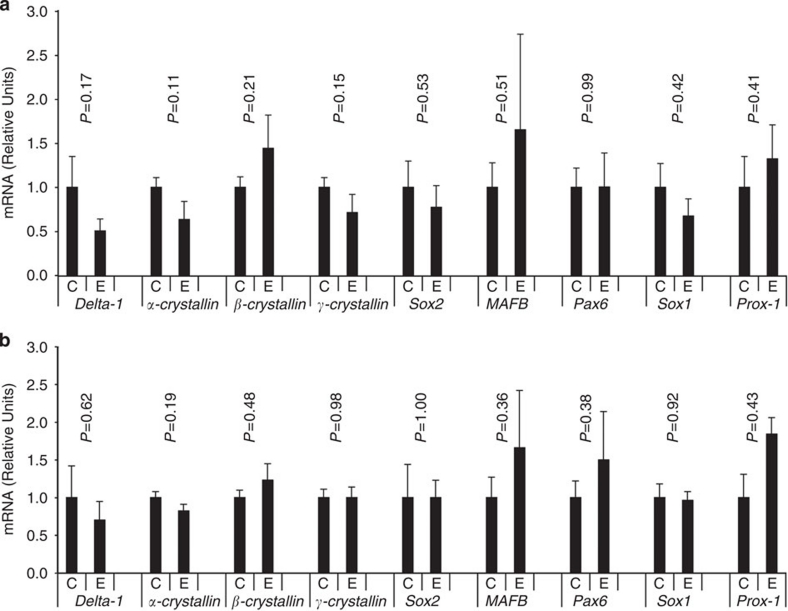
Figure 3. qPCR analysis of gene expression after 17 lentectomies.
Four different sets of lenses (from four different animals) were used and RNA was prepared separately from each. qPCR analysis was performed for each sample and the data combined, as shown in figure. C, control groups; E, experimental, no. 17. (a) qPCR data were normalized to housekeeping gene, GAPDH. (b) qPCR data were normalized to housekeeping gene EF1-a. Bars indicate the standard error of the mean (s.e.m.). Statistical analysis by t-test.

