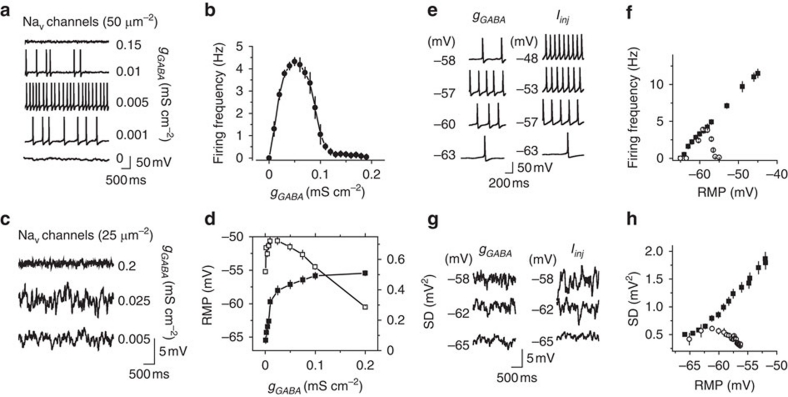
Figure 2. The effect of depolarizing tonic GABAA conductance on a model neuron.
(a) Sample traces of the cell firing induced by gGABA. (b) Summary plot of the cell firing frequency versus gGABA (n=10) (c) Sample traces of the effect of gGABA on RMP fluctuations set by stochastic channel openings. The Na+ channel density was reduced by half compared with panel a to avoid cell firing. (d) Summary plot of RMP (black squares, n=10) and RMP standard deviation (s.d., white squares, n=10) versus gGABA. (e) Representative traces of membrane potential at different RMPs produced by gGABA (left panel) and by Iinj (right panel). (f) Summary data of the change in the model cell firing at different RMPs set by gGABA (empty circles, n=10) and by Iinj (black squares, n=10). (g) Representative traces of membrane potential at different RMPs produced by gGABA (left panel) and by Iinj (right panel). gNa was reduced by half to prevent the cell from firing. (h) Mean standard deviation of RMP (s.d.) at different RMPs set by gGABA (empty circles, n=10) and by Iinj (black squares, n=10). Error bars, s.e.m.

