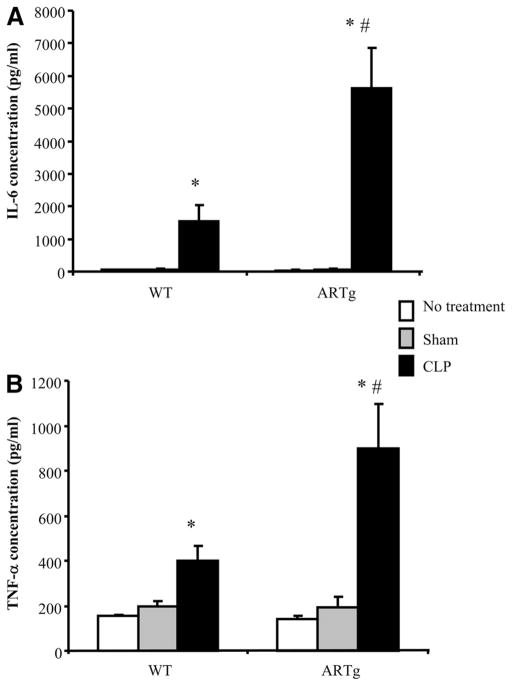
FIGURE 1.
Circulating IL-6 and TNF-α levels during CLP in WT mice and mice expressing human AR (ARTg). The expression of IL-6 (A) and TNF-α(B) was measured using ELISA. □, Mice receiving no treatment;
 , mice receiving sham procedure; and ■, mice receiving CLP. Data represent mean ± SEM (n =4–9 individual animals each group). *, p < 0.05 when compared with mice that received no treatment or sham-operated; #, p < 0.05 when compared with WT mice in the corresponding group.

