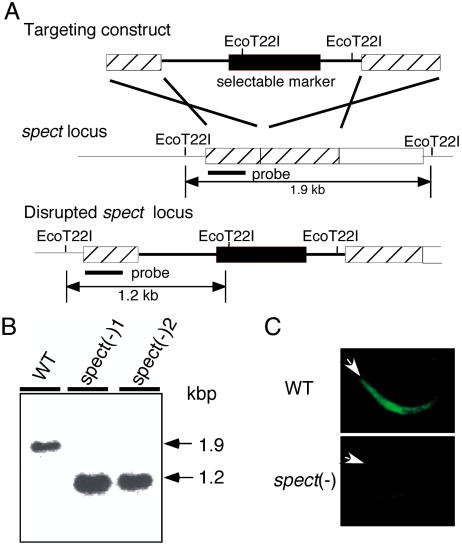
Figure 3. Targeted Disruption of the spect Gene.
(A) Schematic representation of targeted disruption of the spect gene. The targeting vector (top) containing a selectable marker gene is integrated into the spect gene locus (middle) by double crossover. This recombination event resulted in the disruption of the spect gene and confers pyrimethamine resistance to disruptants (bottom).
(B) Genomic Southern blot hybridization of wild-type (WT) and spect(−) populations. Genomic DNA isolated from the respective parasite populations was digested with EcoT22I and hybridized with the probe indicated in (A) by a solid bar. By integration of the targeting construct, the size of detected fragments was decreased from 1.9 kbp to 1.2 kbp. The result is shown for two independently prepared populations, spect(−)1 and spect(−)2.
(C) Immunofluorescence microscopy of the wild-type (WT) and spect(−) parasite. Sporozoites were collected from the salivary gland and stained with primary antibody against SPECT followed by FITC-conjugated secondary antibodies. The apical end of each sporozoite is indicated by an arrowhead.

