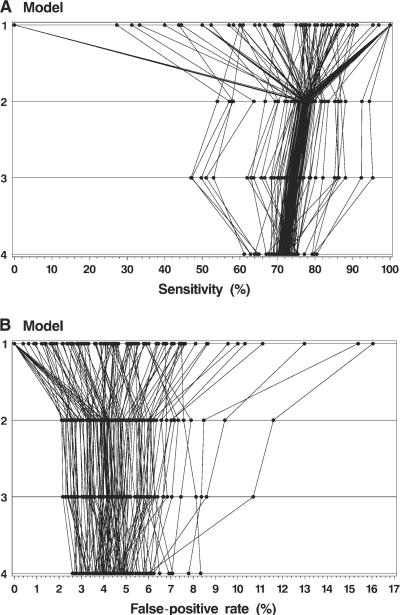
Fig. 4.
Observed and adjusted sensitivity (A) and false-positive rate (B) for each radiologist. Model 1 = observed (unadjusted) rates; model 2 = adjusted for registry and correlation within radiologists; model 3 = additionally adjusted for patient characteristics (age, breast density, time since last mammography examination, and self-reported presence of a breast lump); model 4 = additionally adjusted for radiologist characteristics. Data for each radiologist have been connected with a line.

