
Figure 2.
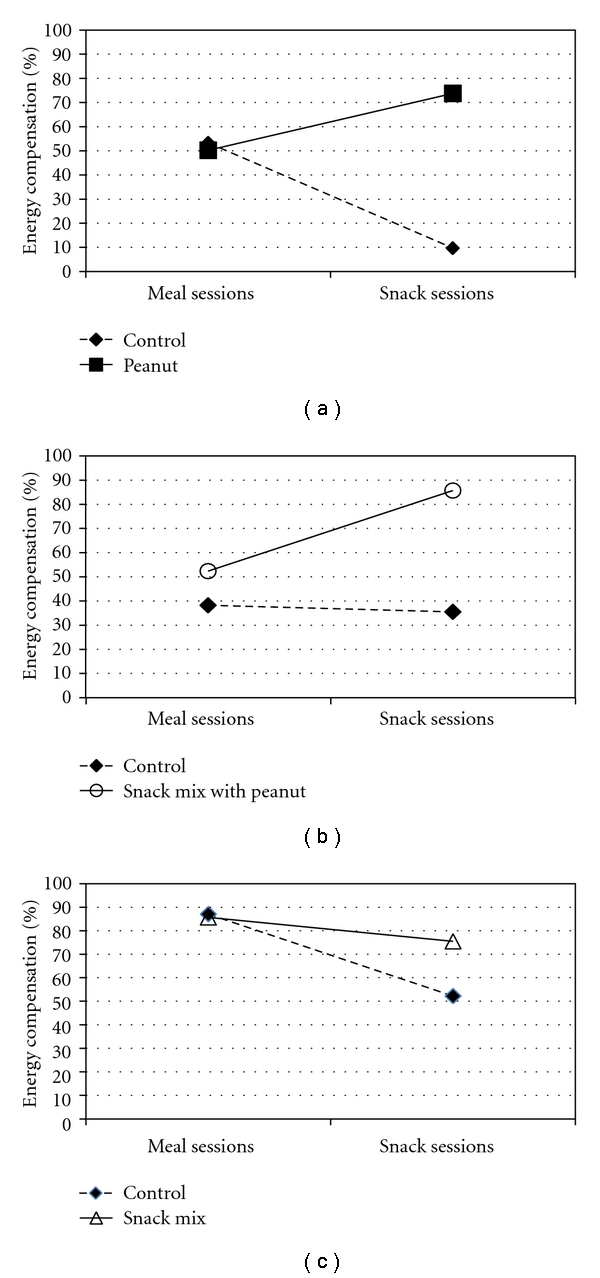
Mean energy compensation observed after ingestion of the test loads. Data are mean values of energy compensation due to the ingestion of the loads.
Official websites use .gov
A
.gov website belongs to an official
government organization in the United States.
Secure .gov websites use HTTPS
A lock (
) or https:// means you've safely
connected to the .gov website. Share sensitive
information only on official, secure websites.
Mean energy compensation observed after ingestion of the test loads. Data are mean values of energy compensation due to the ingestion of the loads.