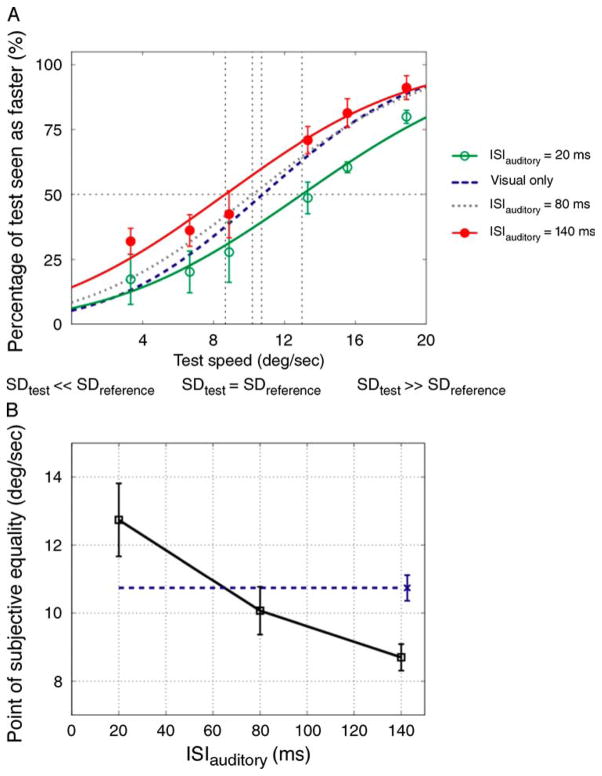
Figure 5.
Results of Experiment 2c. (A) Group averaged data (N = 3, two were naïve observers) for different ISIauditory conditions. The plot indicates the proportion of trials in which the test stimulus was judged to move faster than the reference stimulus as a function of test speed (deg/sec). The open and filled symbols represent 20 and 140 ms ISIauditory conditions, respectively. The dotted and dashed curves indicate visual-only and 80 ms ISIauditory psychometric fits, respectively. The error bars for the visual-only and 80 ms ISIauditory conditions were similar to those in the other conditions and were omitted to avoid clutter. (B) The averaged PSEs of all observers as a function of ISIauditory. Other conventions are the same as those in Figure 4.

