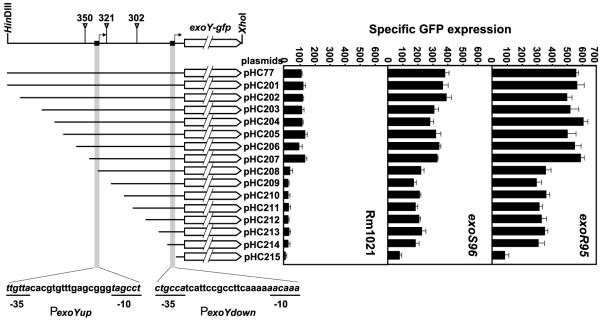
Fig. 1.
Schematic representation of nested deletions in the exoY promoter region and the effects of the deletions on the expression of the exoY gene in the wild-type, exoR95, and exoS96 mutant backgrounds. A line graph is used to show the exoY and exoX genes, and the positions of three transposon insertions. The positions of the proposed exoY promoters are marked by short solid bars and arrows. The solid lines are used to represent the regions of the exoY promoter carried on each of the plasmids. Two gray vertical bars represent the relative position of the proposed exoY promoters. The sequences of the proposed exoY promoters are shown at the bottom of the bars. The promoter activities of the set of plasmids carrying nested deletions in wild-type Rm1021, exoR95, and exoS96 mutant backgrounds are shown in three different bar graphs.

