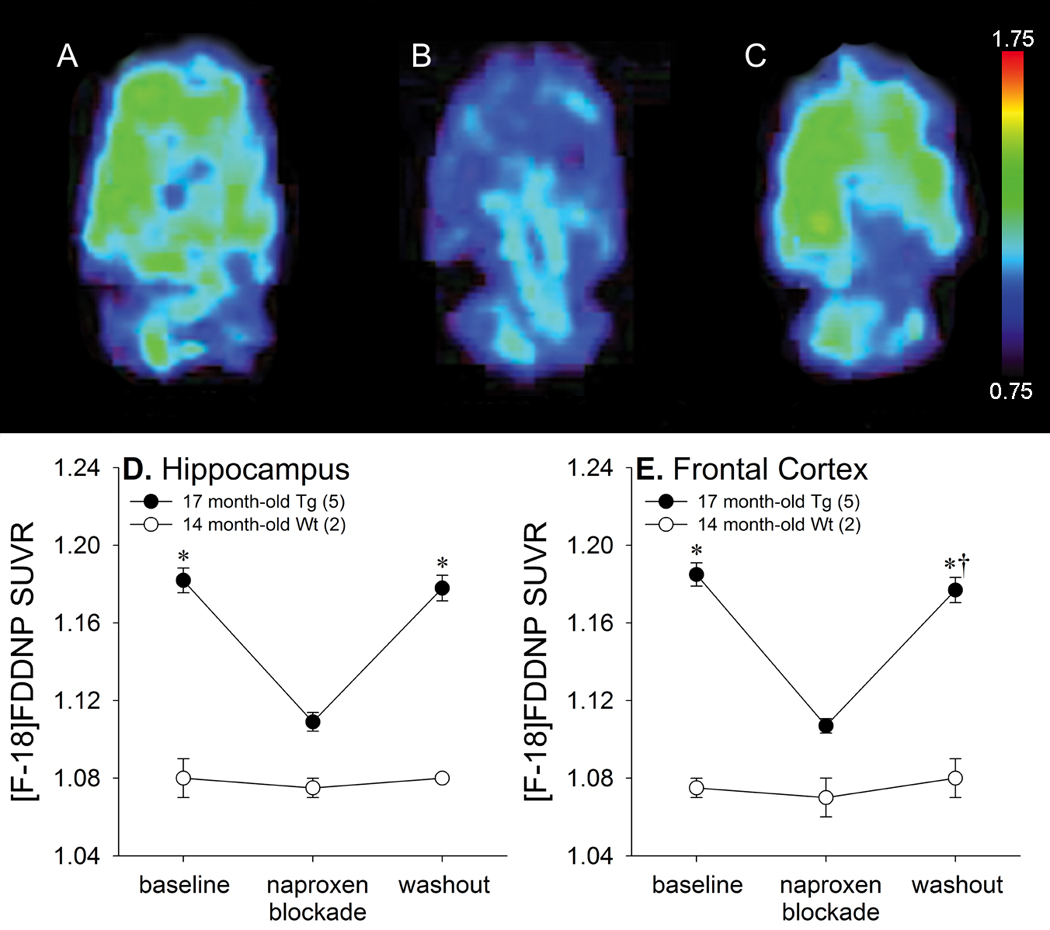
Figure 7.

Naproxen blockade of [F-18]FDDNP binding in 17 month-old transgenic rats. Representative [F-18]FDDNP SUVR images in the horizontal plane at baseline (A), after naproxen administration (B), and after naproxen washout (C). Warmer colors represent higher signal. Average [F-18]FDDNP SUVR values in the hippocampus (D) and frontal region (E) at baseline, after naproxen administration, and after naproxen washout (* p<0.05 vs. naproxen administration, †p<0.05 vs. baseline). Error bars represent SEM.
