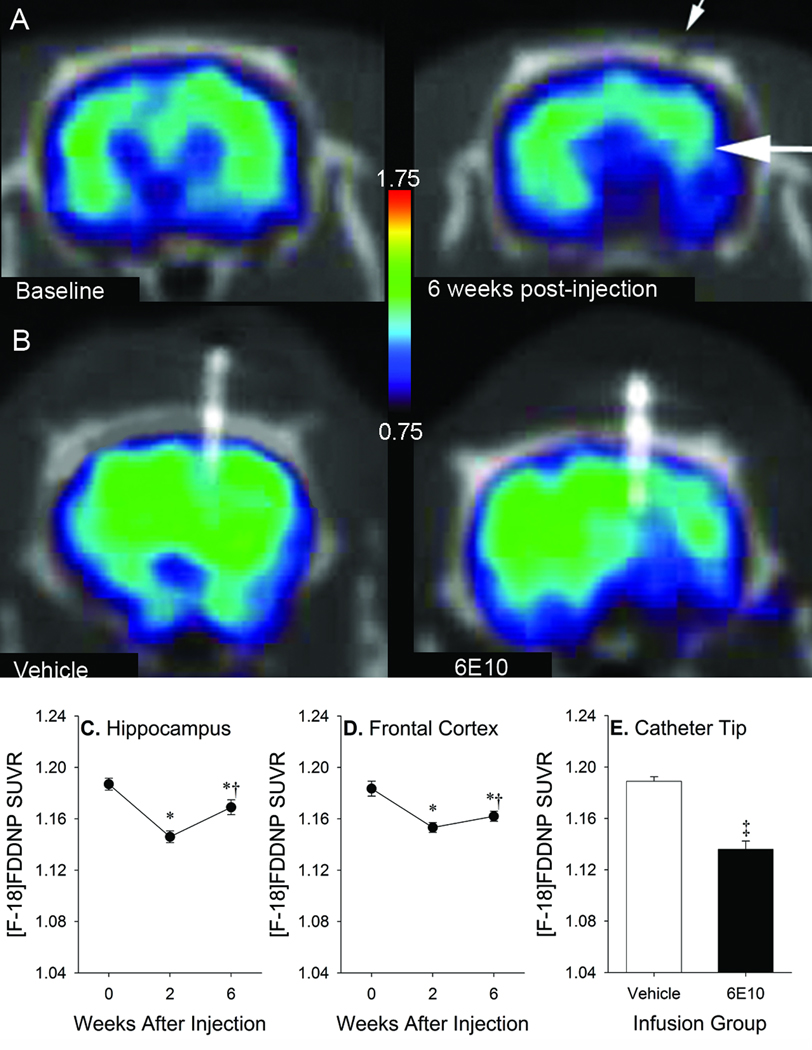
Figure 9.
Representative [F-18]FDDNP SUVR images after 6E10 injection (A) or vehicle or 6E10 infusion (B) in 17–18 month-old transgenic rats. Small arrow denotes skull defect at needle insertion site. Large arrow denotes target region for injection. Warmer colors represent higher signal. SUVR values in hippocampal (C) and frontal (D) ROIs after one-time 6E10 injections in both regions (*p<0.05 vs. baseline, †p<0.05 vs. 2 weeks). SUVR values in ROIs centered on cannula tips at 4–5 weeks after micropump implantation in infused animals (E; ‡ p <0.05 vs. vehicle). Error bars represent SEM.

