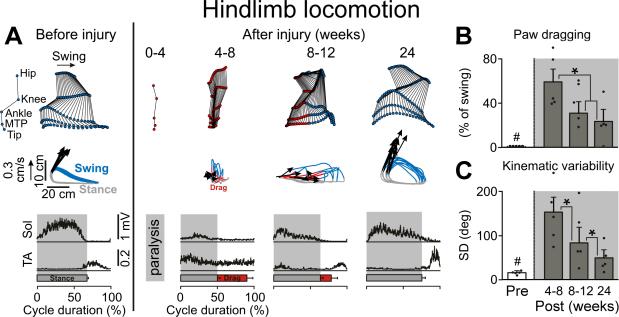
Figure 3. Extensive Recovery of Hindlimb Locomotion After C7 Hemisection.
A: Representative stick diagram decompositions (30 ms between sticks) of lesion-side hindlimb movements during the swing phase while stepping quadrupedally on the treadmill at 0.45 m/s before and at different time points post-injury. The successive (n = 10 steps), color-coded trajectories (blue, swing; red, drag; grey, stance) of the hindlimb endpoint (MTP) are shown together with the intensity and direction of the hindlimb endpoint velocities (arrows) at swing onset. Mean integrated EMG activity (n = 10 steps) of selected hindlimb muscles (Sol, Soleus; TA, Tibialis Anterior) is shown at the bottom of the panel for each time point. Shaded areas indicate the duration of the stance phase, red bars indicate the duration of paw dragging. B: Mean (+SEM) duration of paw dragging expressed as a percentage of the total swing phase duration at each time point tested. Dots represent individual values (n = 5). C: Mean (+SEM) variability of hip, knee, ankle, and MTP joint movements expressed as the sum of the standard deviation (SD) for each joint over 10 successive gait cycles. #, significantly different from all other time points at p<0.05. *, significantly different from indicated time points at p<0.05.

