
Figure 2.
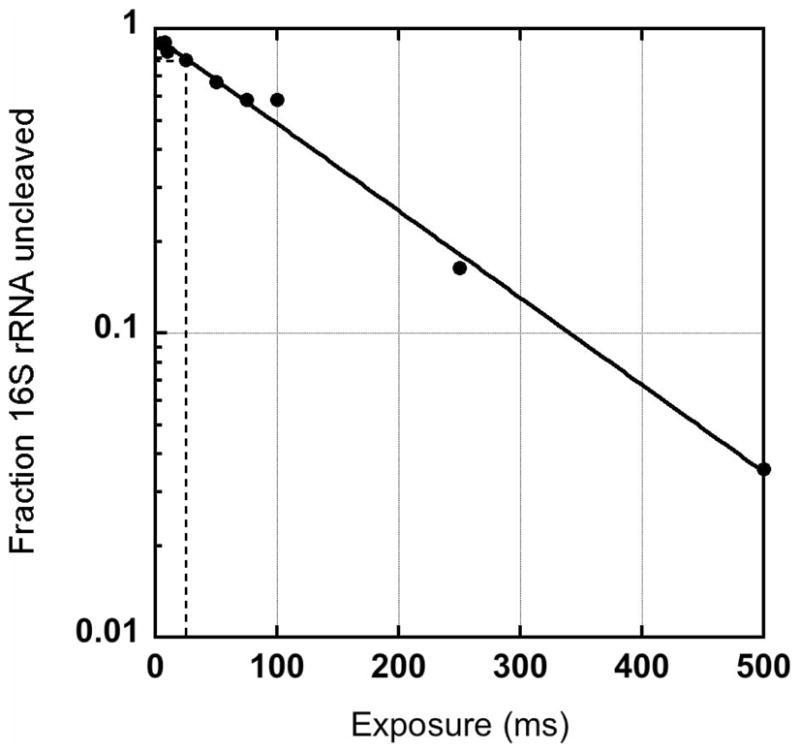
Determining the correct X-ray dose for footprinting. Dose-response curve showing relative fraction of intact 16S rRNA versus time of X-ray exposure of intact, frozen E. coli cells. The optimal dose in this experiment is obtained after 25–50 ms exposure. The relative amount of intact rRNA was determined by primer extension as described in the text.