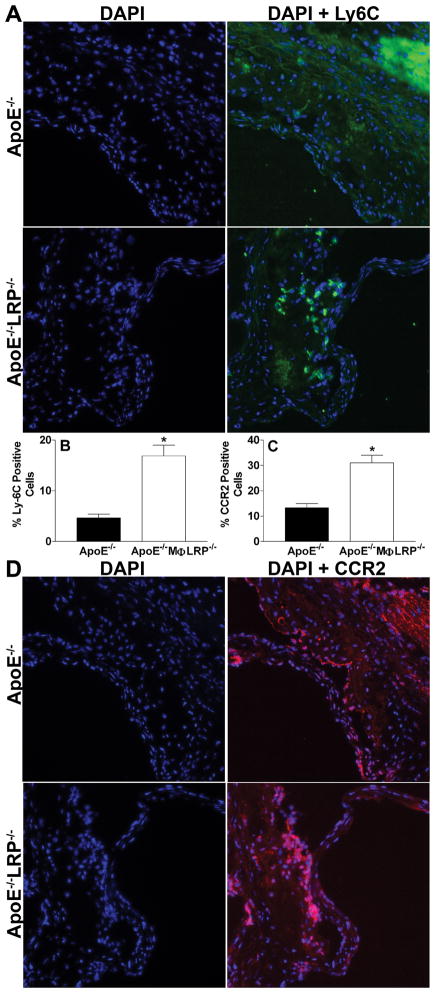
Figure 7. Ly-6C and CCR2 positive cells in lesions of apoE−/− and apoE−/−MΦLRP−/− mice.
A and D Representative images show nuclei (blue, Dapi) and merged images of Ly-6C (A, green) and CCR positive staining (D, red) and nuclei. B and C. Quantitation of the percent Ly-6C (B) and CCR2 (C) positive cells in aortic root sections from apoE−/− and apoE−/−MΦLRP−/− mice (n=6 per group). *p<0.05, Mann-Whitney test.

