
Figure 3.
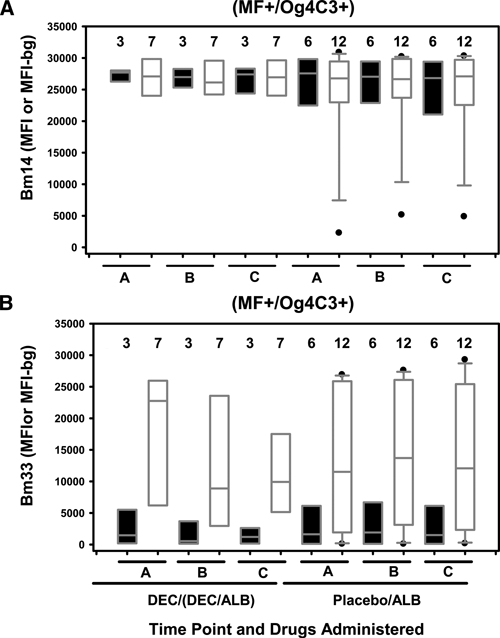
IgG4 and IgG responses to Bm14 and Bm33 for children positive for microfilaremia and antigenemia (MF+/Og4C3+), Haiti. A total of 9 MF+/Og4C3+ children (3 treated with diethylcarbamazine [DEC] or DEC/albendazole [ALB] and 6 treated with placebo or ALB) were tested for IgG4 responses, and a total of 19 MF+/Og4C3 + children (7 treated with DEC or DEC/ALB and 12 treated with placebo or ALB) were tested for IgG responses. Closed and opened box and whisker plots represent IgG4 and IgG responses, respectively. On the left are time points A, B, and C for children who received DEC or DEC/ALB and on the right are time points A, B, and C for children who received placebo or ALB alone. A, IgG4 and IgG responses to Bm14. B, IgG4 and IgG responses to Bm33. Horizontal bars in box: low, 25%; middle, median; upper, 75%. Low whisker, 5%; upper whisker, 95%. Outliers are indicated by closed circles. The number of children is listed above the box. Boxes with no whiskers are less than nine children.