
Figure 2.
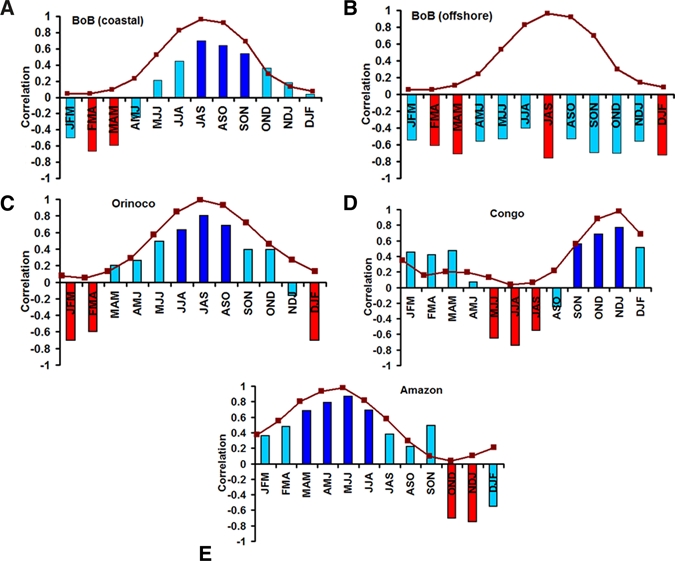
Seasonal correlation between sea surface temperature (SST) and chlorophyll from 1997 to 2010 (A) Bay of Bengal (coastal), (B) Bay of Bengal (offshore), (C) Orinoco, (D) Congo, and (E) Amazon. Deep blue and red bars represent statistically significant correlation (using Kendall Tau test P < 0.05). Brown line, superimposed on the correlation plots, is the seasonal river discharge, scaled between 0 and 1, from respective river basins. J, F, M …D represents January, February, March… December, respectively. JFM, FMA is the mean of three consecutive months.