Fig. 7.
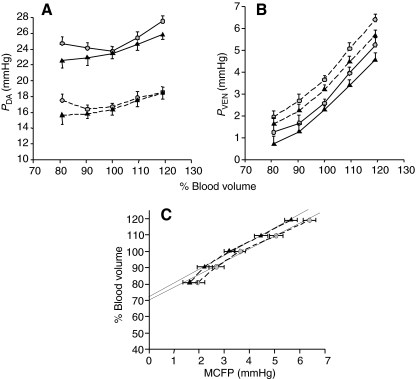
The effects of saline (circles) and CNP (triangles) infusions on (A) dorsal aortic pressure (PDA), (B) central venous pressure (PVEN) and (C) vascular capacitance. Blood volume was manipulated by infusion or withdrawal of blood in increments of 3.5 or 7 ml kg–1 body weight (estimated 10 and 20% of resting volume, respectively) and expressed as a percentage of total initial blood volume. Symbols connected by solid lines represent values obtained during uninterrupted cardiac output; symbols connected by dashed lines represent values obtained during zero-flow cardiac output. CNP infusion at the 80% blood volume resulted in a significant reduction in PDA (compared with saline infusion, *P<0.05) during zero-flow cardiac output (A). CNP infusion at the 120% blood volume resulted in a significant reduction in PVEN (compared with saline infusion, *P<0.05) during zero-flow cardiac output (B). Solid lines in C are regression lines for mean circulatory filling pressure (MCFP) between 90 and 100% blood volume. Their slope is equivalent to vascular compliance (2.9±0.3 ml mmHg–1 kg–1 for saline infusion and 3.1±0.3 ml mmHg–1 kg–1 for CNP infusion), and blood volume intercept at zero MCFP is the unstressed volume (70.0±2.7% for saline infusion and 72.1±2.3% for CNP infusion). Values are means ± s.e.m.

