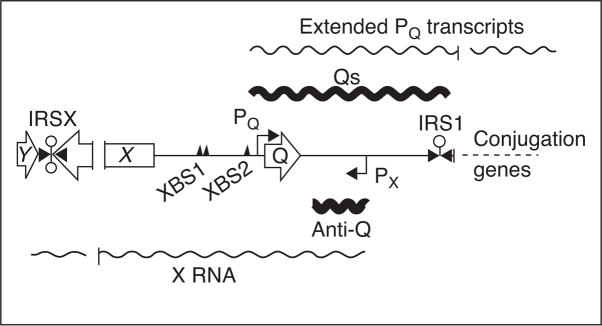
Figure 3.
Genetic organization of prgX and prgQ regions of pCF10 and reciprocal antisense regulation. Map of the prgX and prgQ regions is shown with ORFs for prgY, X, and Q indicated by open arrows. The primary and secondary PrgX binding sites are indicated by triangles labeled XBS1 and XBS2, respectively. The promoters PX and PQ are indicated, along with transcriptional start sites, by bent arrows. Factor-independent terminators are indicated by lollipops. Wavy lines above and below the map indicate RNAs transcribed from PQ and PX, respectively. Transcripts from these two promoters share a 220 bp overlapping complementary region, and published [22••,25• •] and unpublished data C. Johnson & G. Dunny, manuscript in preparation demonstrated that each transcript negatively regulates the corresponding complementary transcript by antisense mechanisms.

