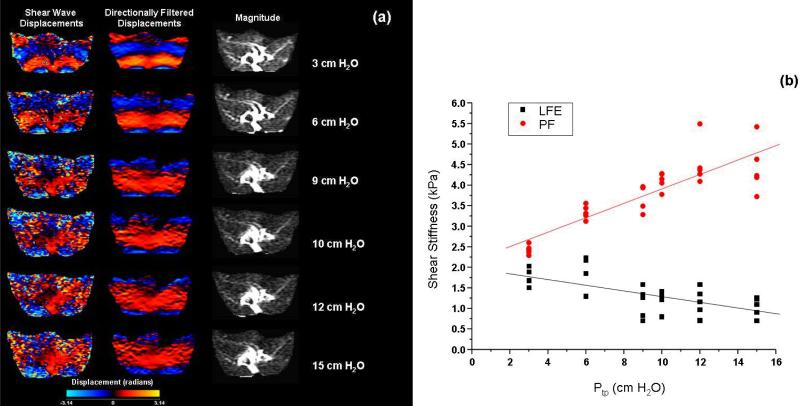
Figure 4.
(a) Shear wave displacement data before (first column) and after directional filtering (middle column) as a function of inflation pressure for data set 5. Note that despite directional filtering, the phase-difference data SNR visually decreases with inflation pressure. The magnitude images for the given slice are presented in the third column. (b) Plot of local frequency estimation (LFE) and principal frequency (PF) estimates of shear stiffness for each slice in this data set as a function of inflation pressure.

