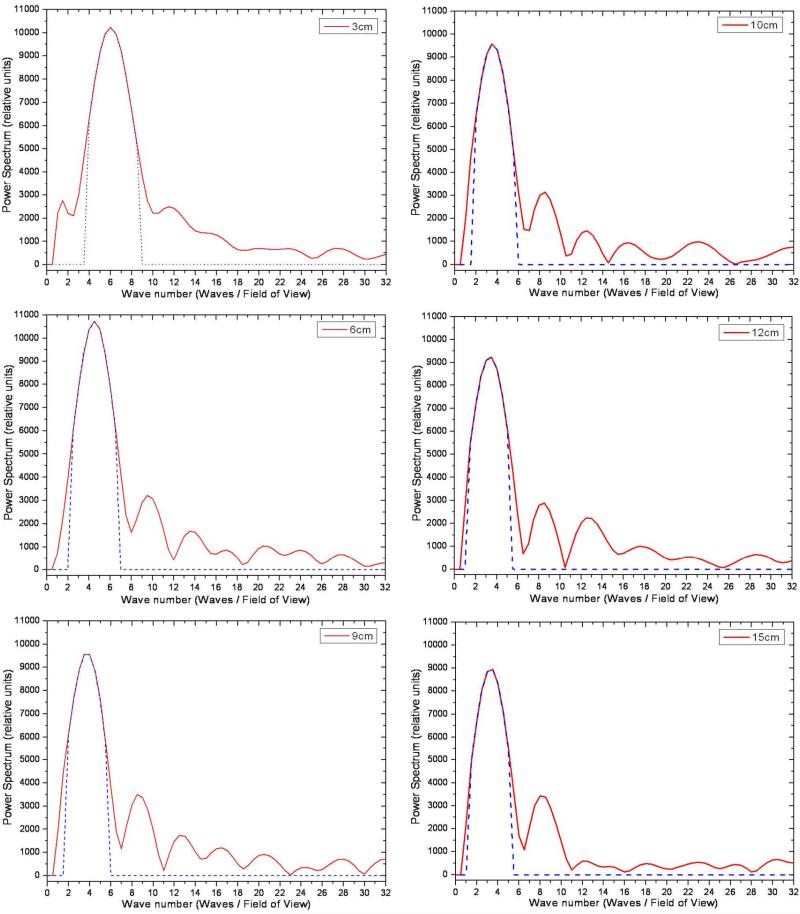
Figure 5.
Power spectrum profiles before (red) and after thresholding (blue dash) for the ex vivo rat lung data set shown in figure 4. The profiles were obtained from the spatial Fourier transform of the first harmonic shear wave data at each of the six lung inflation pressures for a wave number of zero along the spatial frequency direction corresponding to the x-axis of the image. The value of fcentroid was 5.50, 4.02, 3.30, 3.10, 2.93, and 2.90 waves / field of view at inflation pressures of 3, 6, 9, 10, 12, and 15 cm H2O.

