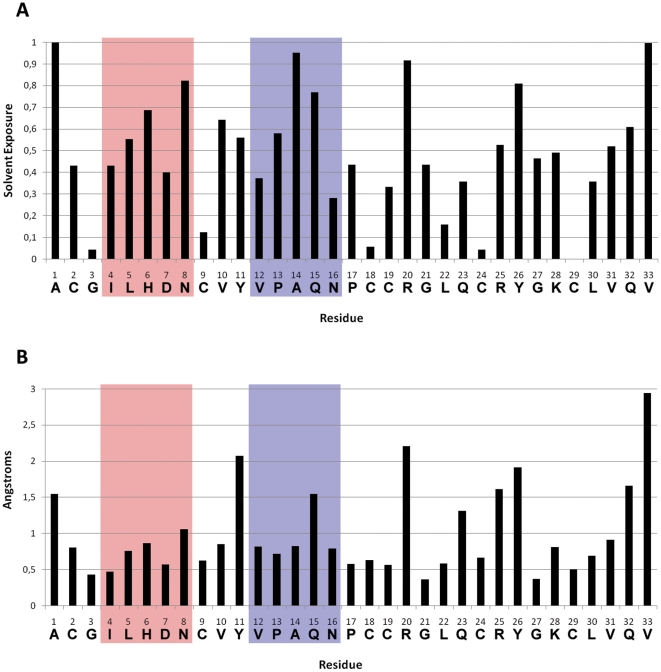
Figure 3. Solvent exposure and RMSF for PcFK1.
The two sites are highlighted in red for Site 1 and blue for Site 2 where D7 and Q15 are the P1 position of Site 1 and Site 2, respectively. (A) shows that most of residues are solvent accessible apart from the cysteine side-chains forming disulphide bridges. The glutamine in position 15 is significantly more exposed than the aspartate in position 7. The RMSF analysis (B) shows that PcFK1 has a fairly rigid structure with few exceptions at the N and C-terminal, and the tyrosines and arginines. The P1 residue of Site 2 (Q15) fluctuates more than its counterpart of Site 1 (D7).

