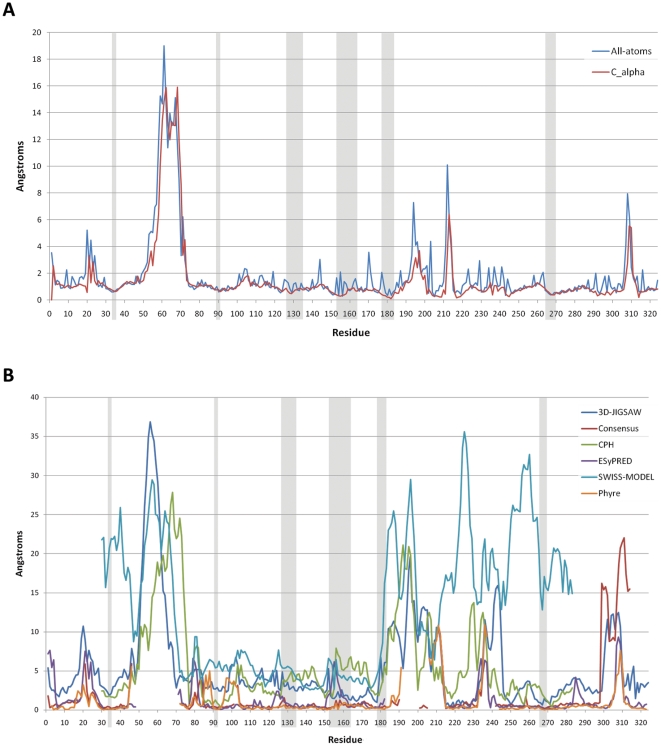
Figure 5. RMSD among models of PfSUB1.
In A the RMS fluctuation on a per-residue basis is plotted for the 10 best models. Gray rectangles highlight the residues forming the binding region. (B) Comparison of our best model with models obtained from several modelling servers. Profit was used to calculate by-residue RMSD where the structure alignment was performed using Needleman and Wunsch sequence alignment.

