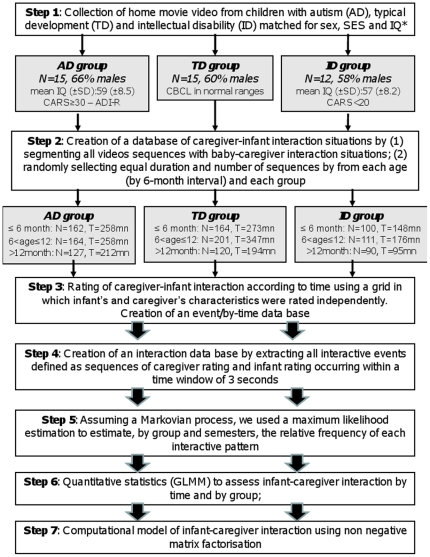
Figure 1. Diagram flow of the study.
SES = Socio Economic Status; IQ = Intellectual quotient; CARS = Children Autism Rating Scale; CBCL = Child Behavior Check List; SD = Standard Deviation; GLMM = Generalized Linear Mixed Model; *IQ matching only between ID and AD children and based on Griffiths Mental Developmental Scale or Wechsler Intelligent Scale.

