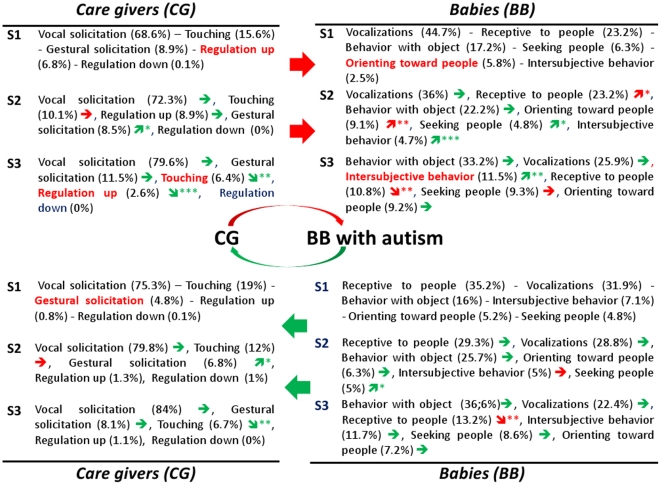
Figure 5. Developmental view of main interactive behaviors for infants with autism.
Top: Care-Givers towards Babies/Down: Babies towards Care-Givers. S = Semester; See Table 1 for a brief description of cited infant's or care-giver's behaviors and meta-behaviors. In brackets: % of this behavior inside the whole interactions of the group in the semester. The arrow indicates behaviors that significantly grow ( ) or decrease (
 ) compared with the previous semester (*p<0.05; **p<0.01; ***p<0.001). The red color indicates a significant difference when compared with TD: behavior in red color means that it differs in a group comparison (inside a given semester); arrow in red color means that the progression over time differs from that of the TD children (meaning the arrow has not the same direction). Significant p values are given in the text.

