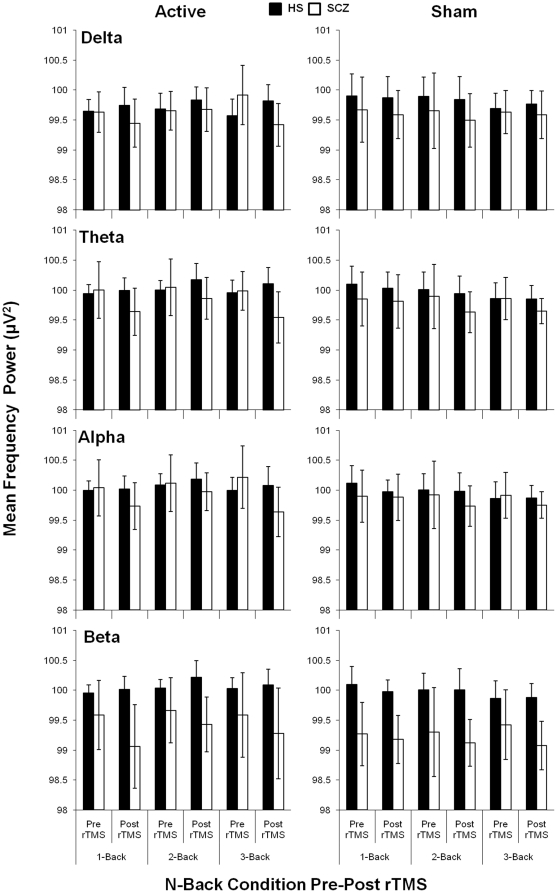
Figure 4. Mean log transformed oscillatory power (uV2) for target correct (TC) and non-target correct (NTC) responses during the N-back task pre-post rTMS in healthy subjects (HS; N = 22) versus patients with schizophrenia (SCZ; N = 24) across delta (δ; 1–3.5 Hz), theta (θ; 4–7 Hz), alpha (α; 8–12 Hz), and beta (β; 12.5–28 Hz) frequency ranges.
Bars represent (±) 1 standard deviation.

