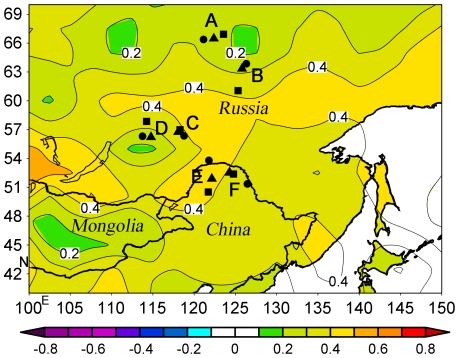
Figure 1. Map of correlation between annual mean precipitable water and annual AMO index (1948–2007) across northeast Asia.
Country boundaries for Russia, Mongolia, and northeast China are shown on the map. It is plotted by the NOAA/ESRL Physical Science Division, Boulder Colorado (http://www.esrl.noaa.gov). Letters on the map represent different tree-ring sampling sites: A – Zhigansk, B –Khotugn, C – Tschita, D – Taksimo, E – Mangui, F – Mengkeshan. Triangles, circles, and squares represent sampling sites, PDSI points, and weather stations, respectively. Differents colors represent different correlation coefficients marked as the legend at the bottom of the map. The figure on a contour represents the correlation coefficient of this contour.

