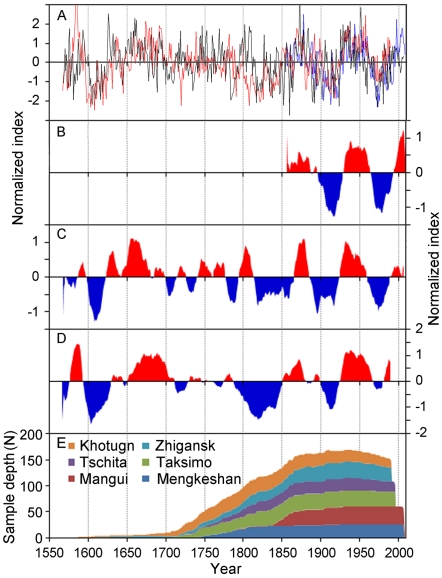
Figure 3. Comparisons of the intrumental, reconstructed (this study) and Gry et al. (2004) reconstructed AMO index on annual and 11-year moving average basis.
(A) Annual comparison of instrumental AMO index [4] (blue line), the reconstructed proxy series from this study (black line), and [20] tree-ring based AMO reconstruction (red line). (B–D) The above three records smoothed with an 11-year low-pass filter. Red and blue shaded areas represent warm and cold AMO phases respectively. All series (A–D) were normalized by their means and standard deviations. (E) Sample depth in number of cores for the six tree-ring width chronologies.

