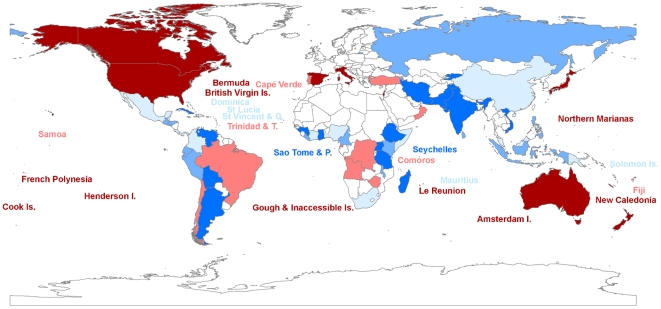
Figure 3. Map of priorities for funding of Single Site Threatened Species (SSTS) based on the balance between the purchasing power parity and the corruption index.
Quintile colours run from dark blue (high returns on investment) through light blue, pink and red to crimson (low returns on investment). Countries in white lacked analysed SSTS.

