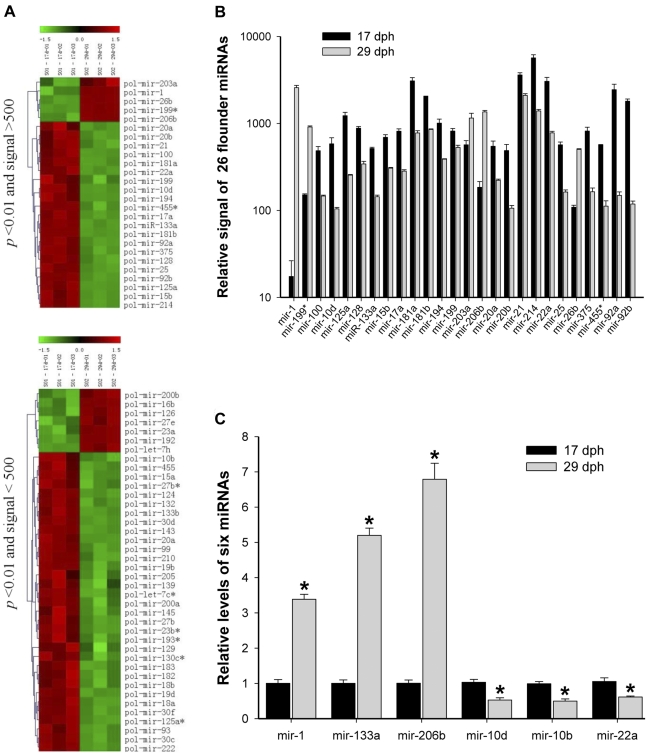
Figure 4. Differential expression levels of miRNAs in the 17 and 29 dph.
(A) Differential expression of miRNAs at two metamorphic stages (17 and 29 dph) by hierarchical clustering. Upside: Differential expression of 26 miRNAs at the two stages (p<0.01 and signal >500). Downside: Differential expression of 40 miRNAs at the two stages (p<0.01 and signal <500). Red indicates that a gene is highly expressed at that stage, whereas green indicates the opposite. The absolute signal intensity ranges from −1.5 to +1.5, with corresponding color changes from blue to green, yellow and red. The signal of expression was detected by microarray with three probe repeats. (B) Relative detectable signals of 26 differentially expressed miRNAs (p<0.01 and signal >500) at two metamorphic stages (17 and 29 dph) by microarray. The signals are average (of three replicates) absolute intensity. (C) Relative expression levels of six miRNAs (mir-1, -133a, -206b, -10d, -10b and -22a) at two metamorphic stages (17 and 29 dph) by Quantitative real-time PCR. * p<0.05 means a statistically significant difference between this miRNA levels at 17 and 29 dph.

