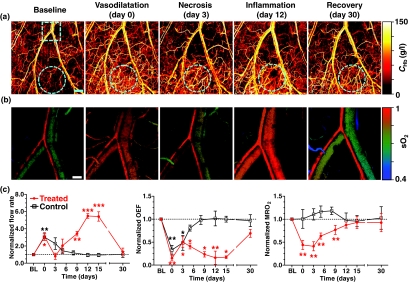
Figure 4.
mPAM monitoring of hemodynamic responses after cryotherapy. (a) mPAM vasculature images acquired in different phases before and after the application of liquid nitrogen. The treated area is indicated by cyan dashed circles. Scale bar: 500 μm. (b) mPAM images of sO2 in the artery-vein pair [cyan dashed box in (a)] that supports the treated area. Scale bar: 125 μm. (c) mPAM quantification of blood flow rate, OEF and MRO2 within 30 days after the treatment. A neighboring area close to the treated region was monitored as a control. Statistics: paired Student's t-test. * p < 0.05, ** p < 0.01, *** p < 0.001, n = 4. Data are presented as means ± s.e.m. Baseline flow rates: 0.72 ± 0.12 μl/min (treated) and 0.44 ± 0.15 μl/min (control); baseline OEF: 0.35 ± 0.04 (treated) and 0.31 ± 0.05 (control); baseline MRO2: 0.30 ± 0.06 ml/100 g/min (treated) and 0.25 ± 0.07 ml/100 g/min (control). BL: baseline. (Color online only.)

