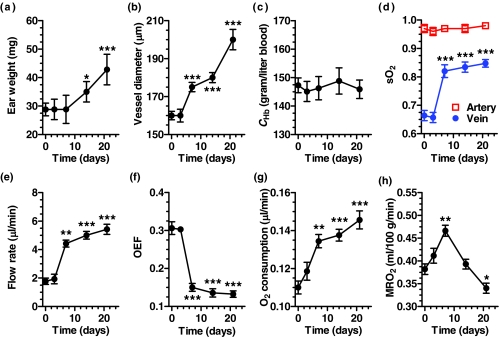
Figure 6.
mPAM characterization of melanoma progression. mPAM measurements in absolute units of (a) ear weight, (b) vessel diameter, (c) total hemoglobin concentration, (d) sO2 of hemoglobin, (e) volumetric blood flow rate, (f) OEF, (g) rate of O2 consumption in μl/min, and (h) MRO2 in ml/100 g/min up to 21 days after tumor inoculation. Statistics: paired Student's t-test. * p < 0.05, ** p < 0.01, *** p < 0.001, n = 3. Data are presented as means ± s.e.m.

