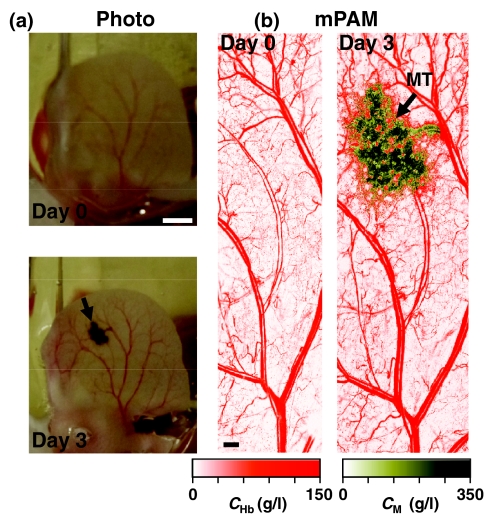
Figure 7.
mPAM differentiation of blood vessels and melanoma. (a) White-light photographs of a representative mouse ear before and three days after the xenotransplantation of B16 melanoma cells. Scale bar: 1 mm. (b) Composite mPAM images of blood vessels (in red) and melanoma (in brown). The two are differentiated by using dual-wavelength excitation at 584 and 605 nm. CHb: total hemoglobin concentration. CM: melanin concentration. Scale bar: 250 μm. MT: melanoma tumor. (Color online only.)

