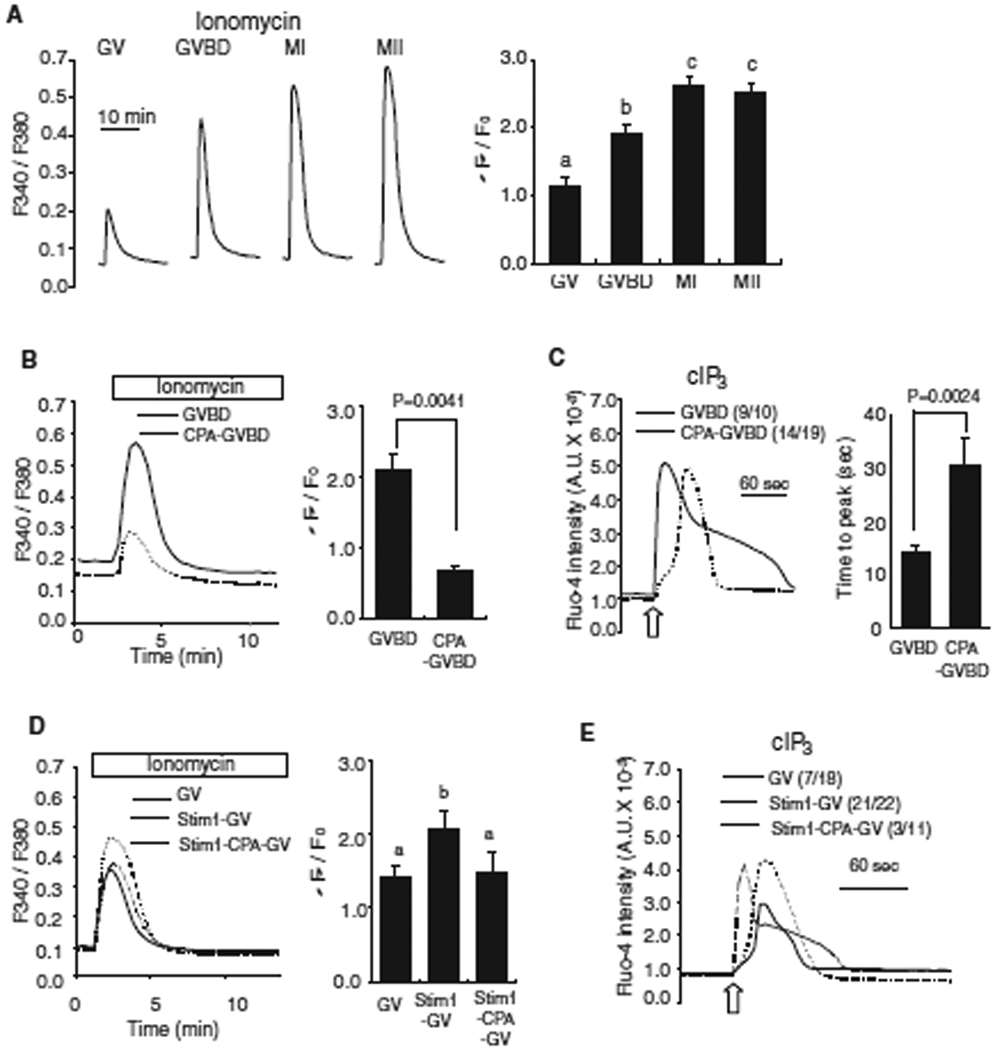
Fig. 2.
The increase in [Ca2+]ER during oocyte maturation enhances IP3R1-mediated Ca2+ release. (A) [Ca2+]ER was estimated from the [Ca2+]i responses induced by the addition of 2 µM ionomycin while oocytes were in Ca2+ free medium. The mean fluorescence peak was compared between the different stages of oocytes and shown on a bar graph. Error bar, SEM (n=10). Bars with different superscripts are significantly different (P < 0.05). (B) [Ca2+]ER was compared in GVBD oocytes matured in the absence (solid line; n=4) or presence (dashed line; n=3) of CPA (50µM). The comparison of fluorescent [Ca2+]i peak is shown in bar graph to the right of the traces. (C) IP3-induced Ca2+ release using cIP3 was measured in control (solid line) and CPA-treaded (dashed line) oocytes. A 0.001 sec UV pulse was applied to oocytes (open arrow) and a representative trace is shown with the number of oocytes responding to cIP3 presented in parentheses. The time needed to reach peak [Ca2+]i fluorescence was measured in each oocyte and compared between the two groups (right graph). (D) [Ca2+]ER was measured in GV-stage control oocytes (solid line; n=10), oocytes injected with Stim1 cRNA (dashed line; n=10) and Stim1-injected oocytes treated with CPA for 2 hrs (dotted line; n=5) after addition of ionomycin; comparisons are shown in a bar graph. (E) A representative [Ca2+]i trace caused by cIP3 release in control (solid line), Stim1 over-expressed oocytes (dashed line) and Stim1-injected oocytes treated with CPA for 2 hrs (dotted line) is shown. The number of oocytes responding to cIP3 is shown in parentheses.

