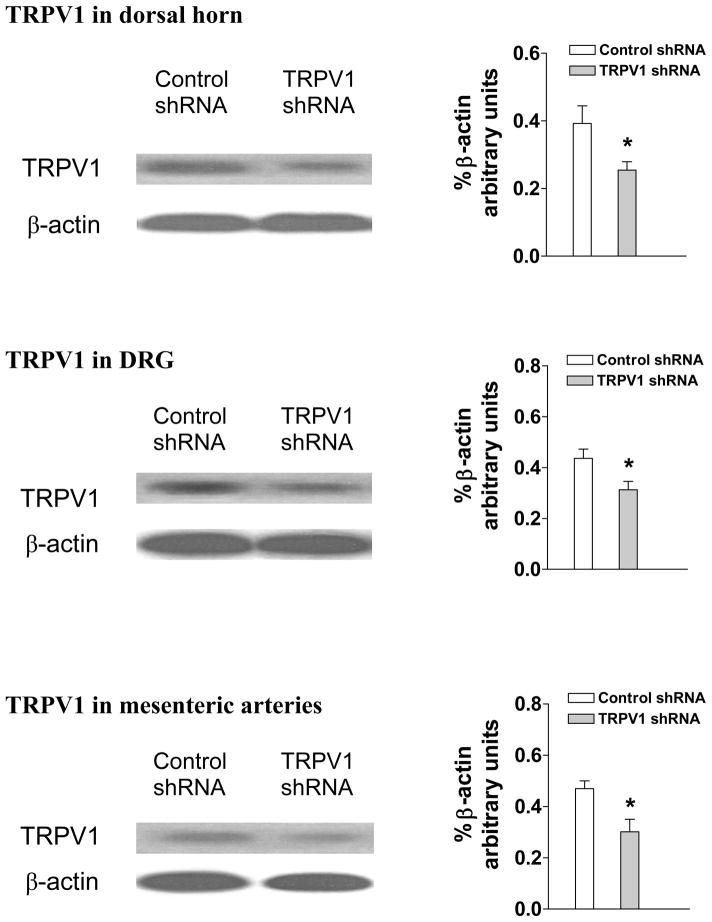
Fig. 3.
Western blot analysis showing TRPV1 expression in dorsal horn of the spinal cord (T8-L3), dorsal root ganglia (DRG) and mesenteric arteries of rats 3 days after control or TRPV1 shRNA treatment. The left and right panels indicate representative Western blots and quantification results (% β-actin arbitrary units), respectively. Values are mean ± SE (n = 5). *P<0.05 compared with control shRNA-treated group.

