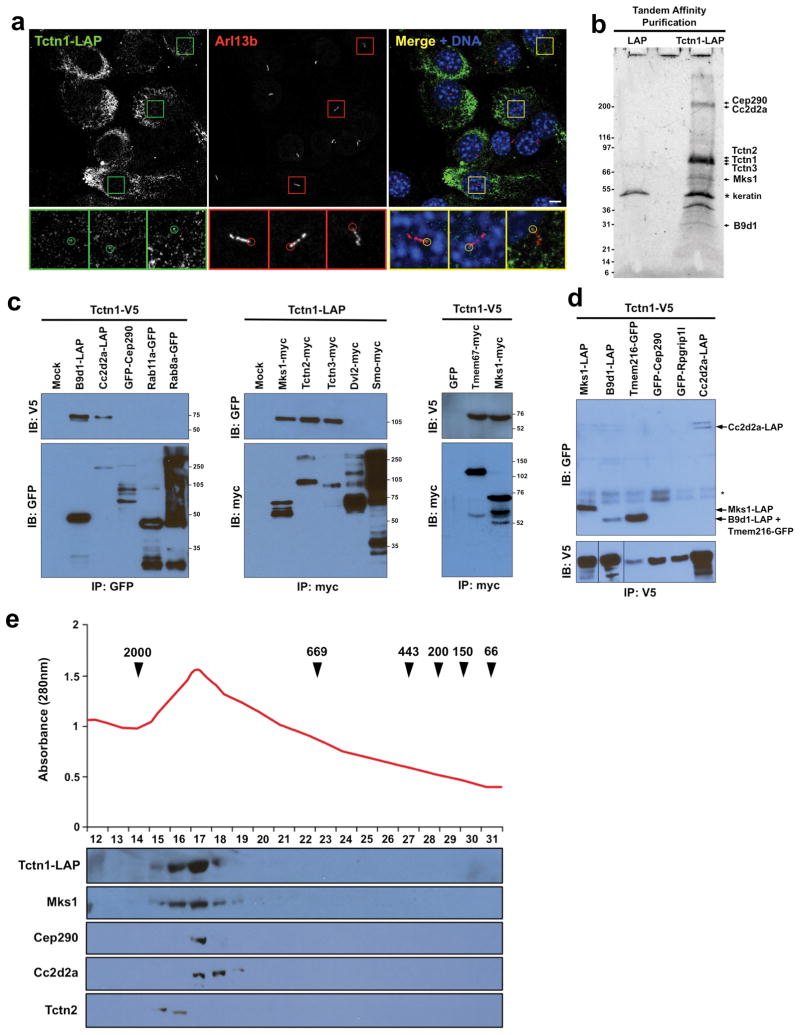
Figure 2. Tctn1 interacts with ciliopathy proteins.
(a) NIH-3T3 cells stably expressing Tctn1-LAP were stained for GFP, part of the LAP tag, and the ciliary marker Arl13b. Tctn1-LAP accumulates at the endoplasmic reticulum, and some Tctn1-LAP is seen at the base of some cilia (insets, 3X magnification of indicated regions). Scale bar 5μm. (b) Tctn1-LAP-associated proteins were purified from stable NIH-3T3 cells and separated by SDS-PAGE. SYPRO ruby staining of the gel revealed several major bands, whose identities were elucidated by mass spectrometry and are indicated on the right (a complete list of interactors is found in Table S1). The sizes of molecular weight markers appear on the left. A control purification is also shown. (c) Immunoblot analysis of immunoprecipitates from lysates of COS1 cells transfected with constructs expressing tagged proteins as labeled at top demonstrated that Mks1, Tctn2, Tctn3, B9d1, Cc2d2a and Tmem67 can immunoprecipitate Tctn1. Size markers in kDa are shown on the right of each panel. (d) Reciprocal immunoprecipitation indicated that Tctn1-V5 can associate with tagged coexpressed Mks1, Tmem216, B9d1 and Cc2d2a. The locations of these proteins are indicated on the right. The asterisk indicates a pair of non-specific bands. (e) Tctn1-LAP was purified from NIH-3T3 cells and analyzed by gel filtration chromatography. The eluted fractions were analyzed for total protein amount (top) and by immunoblot for the indicated proteins. Arrowheads indicate the positions of molecular weight markers, in kDa.

