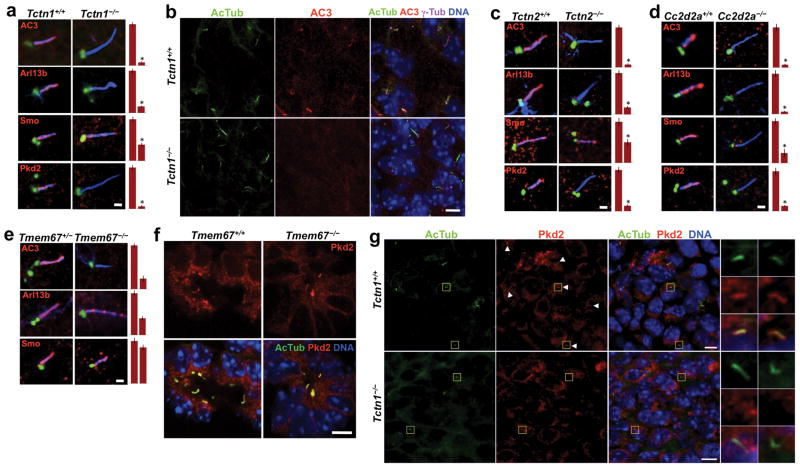
Figure 6. Tctn1 and its interactors control the localization of select ciliary membrane proteins.
(a) MEFs from sibling wild type and Tctn1−/− embryos were stained for AcTub (blue), γ-tubulin (green) and the indicated ciliary proteins (red). Quantifications of the ciliary intensity of these proteins are also shown. Data are shown as mean ± SEM. Asterisk denotes statistical significance according to unpaired Student’s t-tests (* = p<0.01). Scale bar 1μm. (b) E14.5 palatal sections were stained for AcTub, AC3, γ-tubulin and DNA. Ciliary localization of AC3 was evident in wild type embryos, but not in Tctn1−/− embryos. Scale bar 5μm. (c) MEFs from sibling wild type and Tctn2−/− embryos were stained and analyzed as in (a). Scale bar 1μm. (d) MEFs from sibling wild type and Cc2d2a−/− embryos were stained and analyzed as in (a). Scale bar 1μm. (e) MEFs from sibling Tmem67+/− and Tmem67−/− embryos were stained and analyzed as in (a). Scale bar 1μm. (f) E18.5 kidney sections were stained for AcTub, Pkd2 and DNA. Ciliary localization of Pkd2 was evident in both wild type and Tmem67−/− kidney tubules. Scale bar 10μm. (g) E14.5 perineural mesenchyme was stained for AcTub, Pkd2 and DNA. Ciliary localization of Pkd2 was evident in wild type embryos, but not in Tctn1−/− embryos. Boxed regions have been magnified 4X. Scale bars 5μm.

