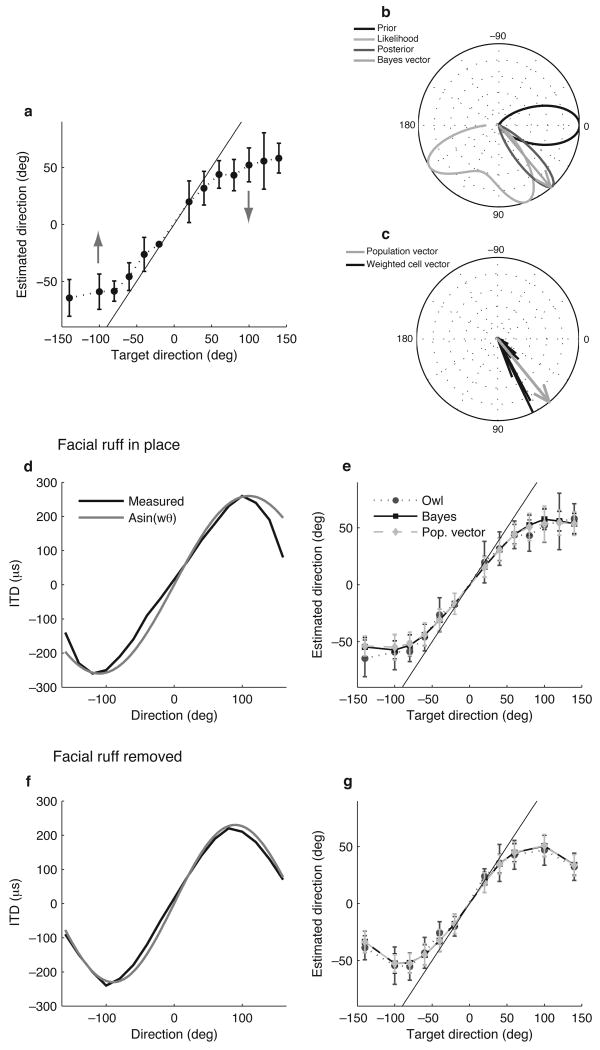
Figure 1.
Models of the owl's behavior. (a) Owl's behavior, modified from ref. 2. The solid gray line is the identity. (b) The Bayesian estimate is the direction of the vector found by averaging unit vectors in each direction weighted by the posterior density (medium gray). The posterior is proportional to the product of the likelihood (light gray) and the prior (black). All probablity densities were normalized by their peak for display. The source direction is 70 degrees, at one of the peaks of the likelihood. (c) The population vector (gray) is the average of the preferred direction vectors of the neurons, weighted by the firing rates (black). (d) Measured relationship between direction and interaural time difference (ITD) (black) under normal conditions2, along with the sinusoidal approximation (gray). (e) Owl's behavior2 (medium gray circle, dotted line), Bayesian estimator (black square, solid line), and population vector (light gray diamond, dashed line) under the normal condition. Error bars represent the standard deviation over trials. (f) Measured relationship between direction and ITD (black) under ruff-removed conditions2, along with the sinusoidal approximation (gray). (g) Owl's behavior2, Bayesian estimator, and population vector under the ruff-removed condition.

