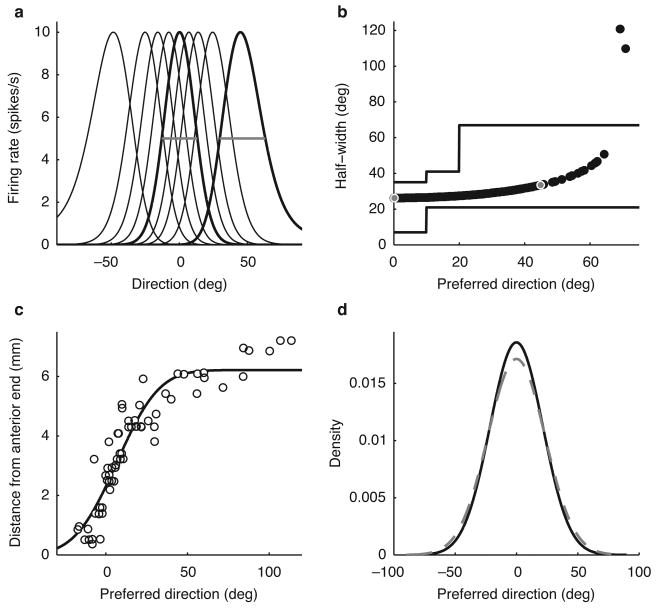
Figure 6.
Predicted midbrain representation of auditory space. (a) Example tuning curves in the model optic tectum (OT) population. (b) Plot of model tuning curve half-widths (black circles) along with experimental data measured in the OT28 (solid lines, showing plus/minus 1 standard deviation, as reported in ref. 28). Gray and white circles correspond to the tuning curves highlighted in (a). The two outlier points correspond to receptive fields in the periphery that wrap around the owl's head, and which are indeed observed in the owl's OT data as well28. (c) Measured values of space map positions of OT neurons (modified from ref. 28) together with the fit by a scaled cumulative Gaussian distribution function (solid line). (d) The model prior density of preferred direction (dashed gray) and the measured bilateral density (solid black) found by combining the unilateral densities derived from the cumulative Gaussian in (c).

