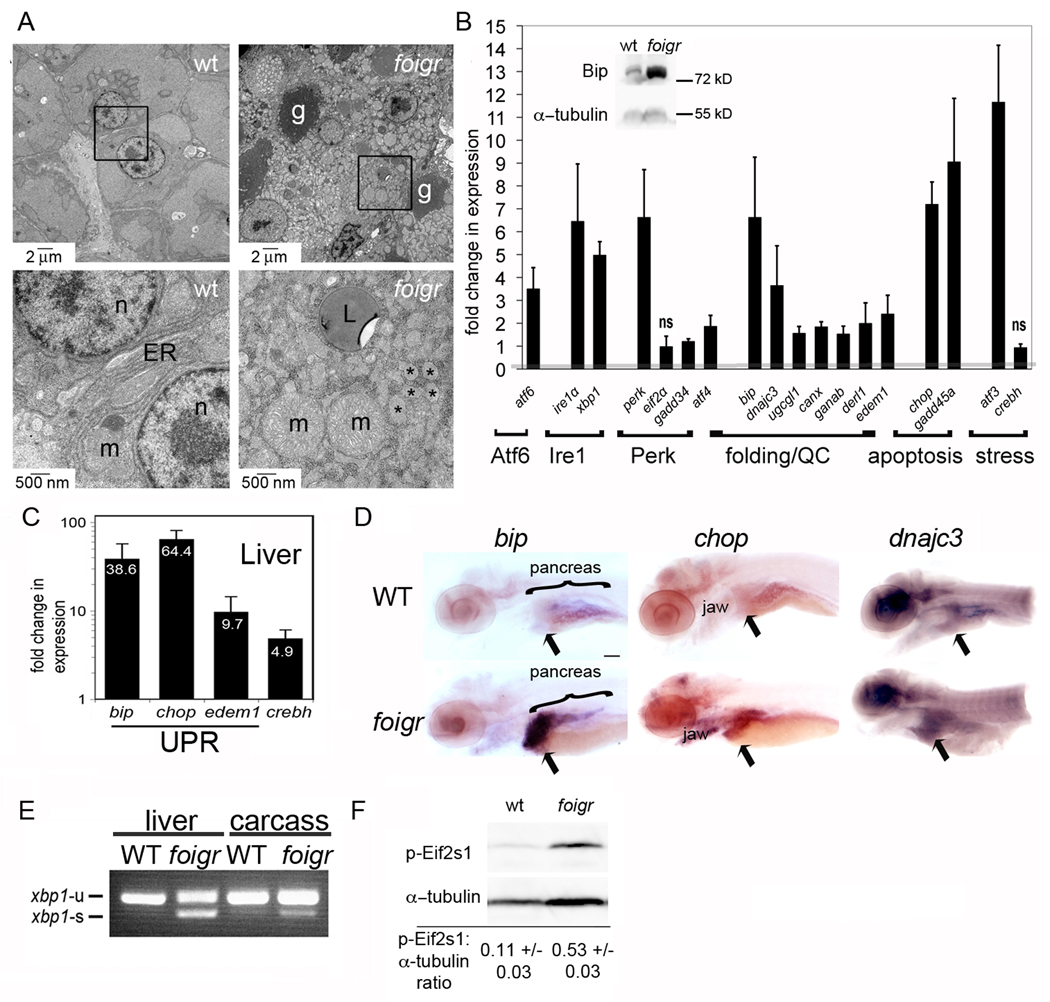
Figure 2. foigr larvae have hepatic ER stress.
A. Electron micrographs of 5 dpf wild-type (left) and foigr (right) livers. The boxed regions in the top panels are magnified in the bottom panels. g: glycogen, m: mitochondria, L: lipid; n: nucleus; * indicates characteristic dilated ER. The cytoplasm of wild-type hepatocytes is full of grey glycogen, whereas only sparse glycogen patches are visible in mutant hepatocytes (g). B. qPCR analysis of UPR gene expression in whole 5 dpf foigr larvae normalized to expression in wild-type siblings (set to 1, indicated by the grey line). The fold change in expression of each gene in mutants compared to their wild-type siblings were averaged for at least 5 clutches and found to be significant using a 1 sample t-test (p<0.01) except where noted as not significant (ns). Genes are grouped by pathway or general function. QC: protein folding quality control. The inset is a representative Western blot of Bip on 5 dpf whole foigr mutants and their wild-type siblings. C. qPCR analysis of a subset of UPR target genes in livers dissected from 5 dpf larvae. The average fold change in 5 clutches of foigr mutant livers normalized to wild-type livers is labeled on each bar. All genes are significantly increased in mutants (p value <0.05 using a 1 sample t-test). D. In situ hybridization for bip, chop and dnajc3 on 5 dpf wild-type (top) and foigr (bottom) larvae. Images are representative of at least 20 embryos from 2 clutches. Staining is observed in the liver (arrow), jaw and exocrine pancreas. Scale bar = 200 µm. E. PCR analysis of xbp1 splicing using primers to detect both unspliced (xbp1-u) and spliced (xbp1-s) xbp1 revealed robust splicing in 5 dpf foigr livers and moderate splicing in the liver-less carcass. Data are representative of 3 experiments. F. Phosphorylated Eif2s1 was detected by Western blotting. The blot was repeated with 6 batches of 5 dpf wild-type and foigr samples and relative band intensity was normalized to α-tubulin, averaged and displayed with the standard deviation; p=0.000008 determined by a t-test. A representative blot is shown. Error bars in all graphs display the standard deviation.

